
I’ve been thinking on and off1 about this paper on the macroeconomic impacts of climate change. It links changes in global temperature to changes in global GDP, in that direction. Warm “shocks” – that is to say, essentially unpredictable jumps in global temperature – lead to a relative decrease in global GDP some years later. Cold shocks do the opposite. The paper is very short on information about how this happens though. Global temperature pops, maths happens, and some years later we’re all worse off. Or a volcano goes boom and some years later, we’re all better off. Why? How?
I put together a diagram that tries to explain why I think an explanation is important in this case. It’s based on a diagram by Nick Hagerty but I prefer my arrows in different places though I think we’re largely making the same point.
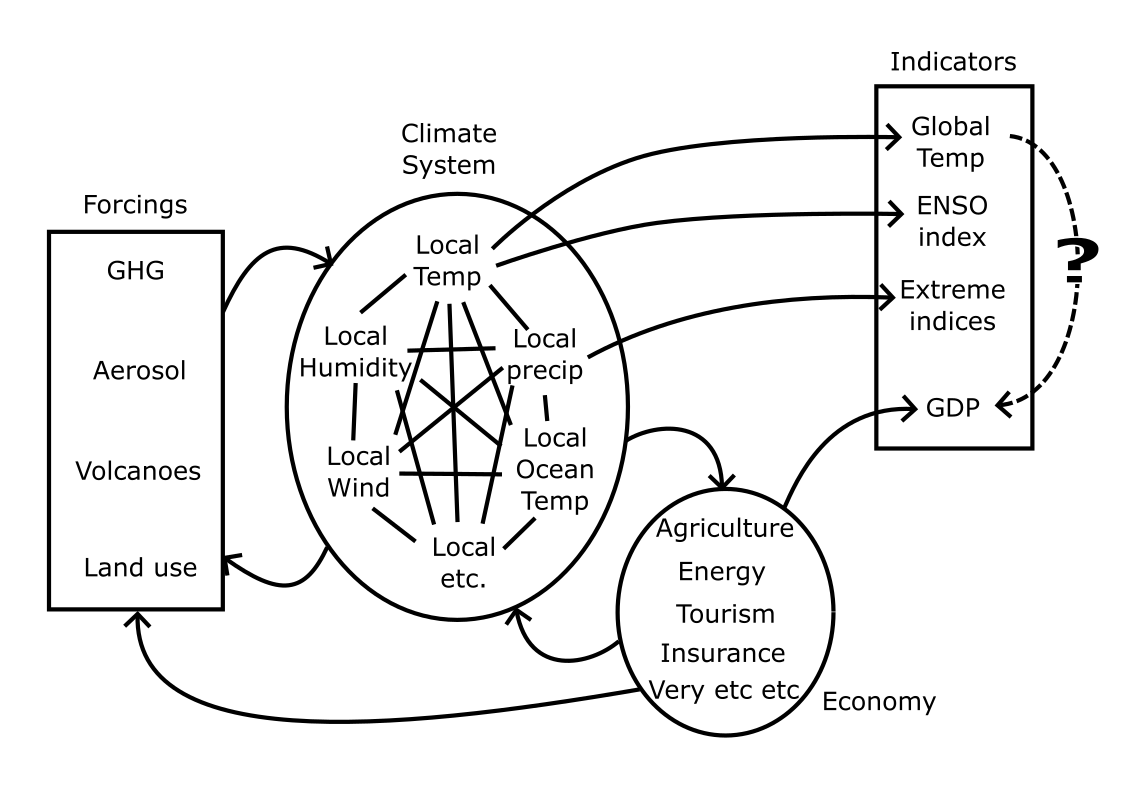
Here I’ve vaguely split the world into “forcings”, the “climate system” and the “economy” as they all sort of overlap. The weather – local temperature and local rainfall – affects agriculture, which affects the economy, which longer-term might affect the forcings. Still, it’s all a bit simplistic. Hopefully you get the idea. There’s also a time element here to which the static graph can’t really do justice. You have to imagine this whole thing changing constantly.
Then separately, we have indicators. The dashed line shows the proposed link from the paper, but indicators like global mean temperature and GDP are just numbers calculated from a bunch of things in the system, and those numbers can’t themselves cause changes2. Climate shocks as defined in the paper are a calculation based on global mean temperature, so it’s a step further removed with lags put in and taken out. GDP is similarly processed.
If global temperature and GDP are related, it’s because both are outputs from the joint economy-climate-system-forcings monster. The method employed doesn’t seem to shed any light on what that connection might be beyond vague ideas that global temperature somehow captures the joined-up-ness of the climate system and extremes. It’s a hand-wavy explanation for why they see a stronger effect when using global temperature as opposed to local temperature.
So far, the authors’ response to criticisms has been to add more processing of indicators and reiterate the robustness of the result. Perhaps this misses the point. Robustness of the result is not the same thing as robustness of the conclusion. Patrick Brown made the point that the effect is big, so one shouldn’t need so much processing to reveal it. He did something simpler and didn’t find such an effect. Of course, doing something simpler is doing something different, so you shouldn’t be surprised if you get a different result. It’s not especially illuminating. At the same time, it’s not clear exactly how they’re performing their controls: which multivariate ENSO index did they use to control for ENSO? how did they use it etc? It’s all a bit frustrating.
What I’d like to see is a careful tracing of what’s going on in just the first two formulae in the paper. It’s already moderately complex, but oughtn’t to be too difficult to tease apart. It also provides the first substantial “result” in the paper. Code and data would help here as it’s hard to think through the combination of regressing out two lags of global temperature and regressing against 10 lags of differences in logged GDP with serially correlated errors and two lags of GDP as control etc etc3, but I haven’t seen that either data or code is forthcoming.
An interesting aspect of all this, which maybe bears on the interpretation, is how different disciplines arrive at the truth. Or, perhaps more accurately, arrive at papers, and what they find convincing or not. In the discussions on twitter, my previous blog post, which is largely an expression of my ignorance and confusion on the matter, has been bandied about as if it were a rebuttal4. It’s not that I think the paper is wrong per se, I just think it makes a weak case, so I don’t know whether it’s wrong or right. What I’d like to see is the connections mapped out convincingly. For a macroeconomist, it seems those same details don’t matter in quite the same way. Other details do matter though, such as finding the right methods to apply to deal with a trending or autocorrelated predictor, or controlling for oleaginous5 factors. I think these things are important, but they’re not the kind of thing that’s likely to convince me6.
Interface papers – those that sit on the boundaries between disciplines – often seem to have this issue, they lose epistemic traction just as they cross the frontier so the effect can be other than intended7. It could be that the paper gets published, but no one believes it who didn’t already think things were worse than they thought8. That would be kind of sad.
Anyway, that’s all folks.
-fin-
- and on. ↩︎
- Of course, the global temperature index once calculated kicked off a planetwide effort to stop it going up as well as planet wide resistance to that… I’ve resisted the urge to draw more arrows on here to represent such nebulous relationships. ENSO indices that exceed particular thresholds can have effects in the economy, freeing up capital or insurance pay outs or what have you. ↩︎
- Or whatever it is. ↩︎
- And amusingly, has me lumped in with a whole bunch of contrarians. ↩︎
- I may not have fully mastered the lingo. ↩︎
- A data scientist might complain that the data aren’t split into training, testing and validation sets. Other disciplines might see things differently again. ↩︎
- For our sixth form work-experience week, I had neglected to find any place willing to offer me experience, so I, together with the other misfits, spent the week in the nearly empty sixth form common room “revising”. One afternoon, I hatched a plan to enliven things by leaping from one half of the common room to the other, through a narrow archway that was usually blocked off by a coffee table and some chairs. I calculated that I could easily clear these with a good run up and still have enough puff to add to the effect by ululating like a pack of wolves joy-riding in a police car. It would be magnificent. People would talk about it for weeks. However, my calculations had failed to account for the solid concrete lintel that capped the archway. It was much lower than I had anticipated, so the apex of my head met it while my body was still rising, causing my body to concertina suddenly and turning my magnificent siren wail into a noise like a sad accordion. I also lost consciousness and any kind of muscle tension, so I entered the other half of the common room like a bucket full of wet calamari. When I regained consciousness, I was informed that the effect was striking, albeit not in the way that I intended. I feel like interdisciplinary science can be a bit like that sometimes. ↩︎
- Step away from the paradox. Nothing to see here. ↩︎

Leave a comment