I’m trying to get my head around a working paper on “the macroeconomic impact of climate change: global vs local temperature” but the paper is bigger than my brain, so the net effect is of me donk-donking my head against its smooth exterior. The paper estimates that the “macroeconomic damages from climate change are six times larger than previously thought“. More quantitatively they found that “a 1°C increase in global temperature leads to a 12% decline in world GDP” based on the relationship between natural variability in global temperature and GDP. Previous estimates suggested that a 1°C rise in world temperature would reduce GDP by 1-3%.
Economics is not something I am familiar with, so I’ve been trying to understand what this paper means in terms that I understand1. It’s beautifully written and structure, but when it gets to my specialist subject, it doesn’t get off to a good start:
“Climate change originates with a rise in global mean temperature. This change in global temperature affects the Earth’s climate system as a whole—causing changes in weather patterns, ocean currents and atmospheric conditions, which in turn influence the frequency, intensity, and distribution of extreme weather events globally. Thus, we focus on the fundamental variability in global temperature to analyze the full impact of climate change on the world economy.“
Climate change does not originate with a rise in global temperature. The long-term increase in global temperature is perhaps the most prominent symptom of climate change, but global mean temperature itself2 represents an aggregate of local changes which in turn are brought about by changes in forcings – both global and local – as well as internal variability such as the arhythmic pulse of El Niño and La Niña. It’s hard to think of mechanisms whereby the global average temperature could cause something to happen3. On the other hand, global temperature is often used in this way, as a stand in for the effects of climate change, so… <shrug>
We also need to think about what local impacts might be associated with changes in global temperature. El Niño raises global temperature and is associated with changes in local weather patterns across the world. Greenhouse gases also raise global temperatures, but the local effects are expected to be quite different. Similarly, large volcanic eruptions lead to a drop in global temperature, but they have local effects that are distinct from La Niña which also depresses global temperature.
Why am I saying all this, well because global temperature and global GDP both have a trend, it’s not as simple as just regressing one on the other. Instead, the authors pre-process the global temperature data to isolate a trend less series of what they call “climate shocks”. These are shown below.
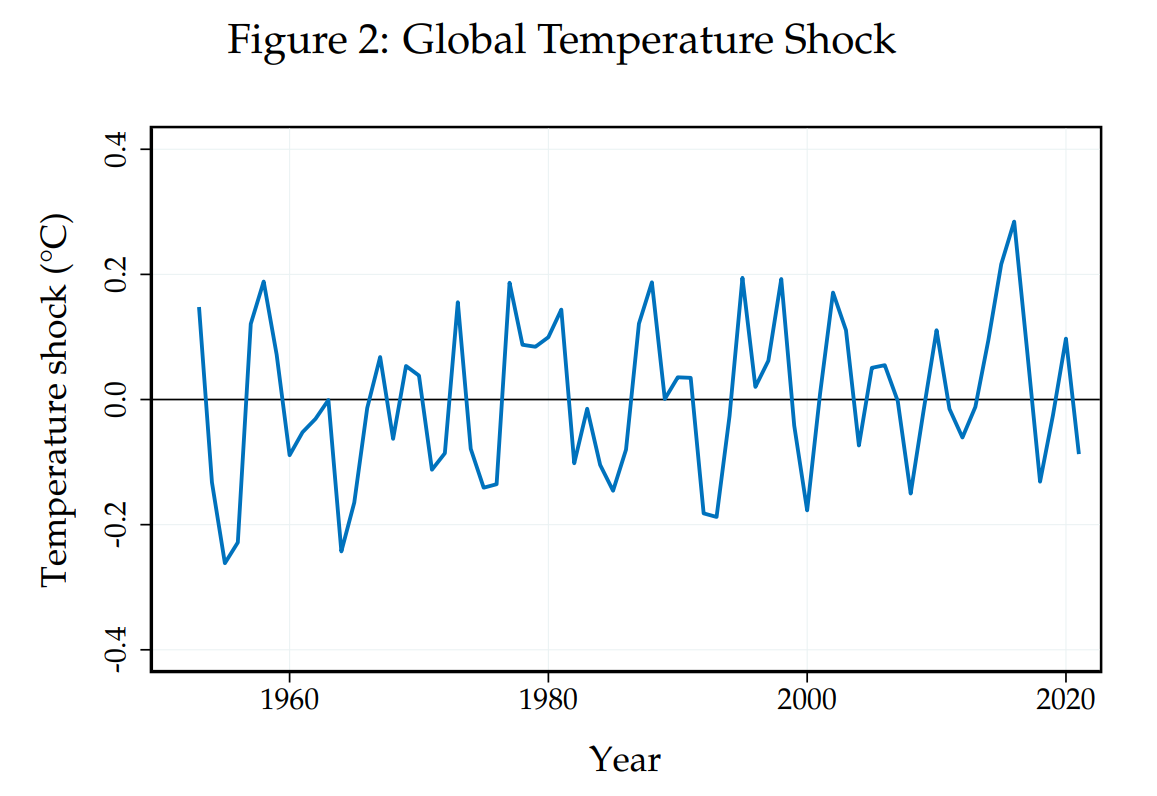
The first question a climatologist has is, “well isn’t this mostly ENSO variability?” To which the answer is yes, with a sprinkling of volcanoes. I’ve overlaid the ONI index (the red and blue bars) on the “global temperature shock” series below. The peaks and troughs largely line up, except when there were large volcanic eruptions: El Chichón in 1982, Pinatubo in 1991 and Mt Agung in 1963/64.

The correspondence isn’t perfect of course, but the ONI index doesn’t exactly represent the effect of ENSO on global temperature and it probably changes from one event to another anyway. The authors suggest that solar effects might also play a role, and that’s entirely possible too.
In their calculation, a global temperature shocks of 1°C leads to an instantaneous drop of 2% in GDP. However, five or six years after the shock that increases to 10% and lasts even longer than that albeit somewhat diminished. 1°C would be a big effect. None of the “shocks” in the time series come close to that. The biggest is around 0.3°C. At the same time, I’m perfectly willing to entertain the possibility that an El Niño that caused a 1°C shock in global temperature would be terrifyingly consequential4. I find myself less willing to consider the possibility that a volcano that led to a 1°C cooling would give us a 10% bump in GDP six years later. It just seems odd.
However, the argument in the paper isn’t that a 1°C El Niño (or volcano) would have this effect, but that a long-term 1°C change in global temperature would. These are, as I mentioned earlier, two very different things (or very likely to be). So I’m left scratching my head.
More head scratching comes when they look at the effect of local temperature changes5. Here they find only a very small effect, much smaller than the effect of global temperature (which as we established can’t really cause anything in and of itself). This suggests that there is something about the global temperature that it’s picking up on – perhaps the large scale correlations and teleconnections it represents – but they can’t really say what.
Anyway, if someone can explain this all to me in terms I can understand, I’d be most grateful.
Update 2024.05.14: I’m not the only one to think there’s something a bit iffy about the paper. To paraphrase, small shocks and long-term climate change are different things with different causes and different impacts.
Under the headings “reconciling the impacts of global and local temperature” and “mechanisms” the authors dig in to the why and how, but it doesn’t reveal much beyond even more confusing results and some very iffy justifications. As to why global temperature better predicts GDP than local temperature, they show that extreme heat, extreme precipitation and extreme wind are all better predicted by global temperature shocks on the grounds that “These findings are consistent with the geoscience literature: wind speed and precipitation are outcomes of the global climate—through oceanic warming and atmospheric humidity—rather than outcomes of local temperature distributions” This would have had more force if they had actually cited some of that literature. Quite why GTS (Global Temperature Shocks) should lead to an increase in extreme precipitation and extreme temperature 8 years later is a puzzle that almost makes one willing to accept the increases seen with a mere 2-year delay. Regarding the link to economic factors, the authors cite two papers, one which shows a persistent long term loss following tropical cyclones (fair enough6), the other to the night-time ventilation of office buildings. The latter paper does indeed find a 2% drop in productivity associated with 1C of warming as the current paper does. Quite why workers in an office building and the whole world should respond in the same way to a 1°C change in temperature is a mystery for another day.
The long-term effects of temperature change are dealt with in section 4 of the paper. Exactly how section 4 and the earlier parts of the paper are connected is what I’m still wrestling with. I don’t get how the Global Temperature Shocks feed into the assessment of how long-term temperature change affects various economic outputs. Figure 13 supposedly shows the output and capital responses to “internally persistent temperature shocks, in the model and in the data. By construction , these responses account for the persistent increase in global temperature levels in response to global temperature shocks as estimated in the data“, referring to Figure 9. Figure 9 doesn’t show that though. It shows a persistent effect on local temperature from a global shock. Section 4.4 seems to be the bit that deals with the relationship between global temperature shocks and persistent global temperature change. They note that “omitting to account for the internal persistence of the temperature shock would overstate the impact of global warming“. They still end up with a very large effect overall.
Update 2024.05.19: The authors have been busy responding to criticisms on twitter. One perhaps surprising result is that controlling for ENSO makes practically no difference to the results. This is surprising because most of the year to year variability in global temperature is related to ENSO. The paper mentions this and two other sources of variability around the trend: solar forcing and volcanoes. These other two are forced responses. Beyond that, we’re down in the noise. That’s not to say there’s nothing there, just that ENSO + volcano + solar doesn’t leave a lot besides. What’s left still looks a bit like ENSO, but in an annoyingly unquantifiable way. This always happens. All methods to remove ENSO variability from global temperature, always seem to leave a little bit behind. What else is left isn’t something we know much about.
I wrote a follow up post: The macroeconomic impact of a number
-fin-
- Mostly cartoons and the promise of food. ↩︎
- Another consideration here is that any particular global temperature can represent very different spatial patterns of warm and cool anomalies. ↩︎
- Except for papers like this. ↩︎
- It’s a bit weird that the largest effect comes five years later, which isn’t too far off the long-term gap between El Niño and La Niña. ↩︎
- Although they use a population weighted temperature, which may or may not be the best metric in this case. ↩︎
- The abstract says “The data reject hypotheses that disasters stimulate growth” which is the kind of conclusion that makes you wonder why anyone would think otherwise. Economists sure are strange. ↩︎

Leave a comment