
There’s a reason1 scientists write papers. They’re a record of what we did. They save us having to explain over and over again, what we did and why. But no one reads any more2 or so I’m told. People mostly seem to work on vibes. For the purveyor of climate datasets this is a pain because the average grumbling critic3 hasn’t read the paper and thus doesn’t know what they’re criticising. The vibes are obviously difficult to triangulate. And it shows. Toby Young goes a step further, taking a page4 from the James Delingpole playbook: interpreting the interpreters, or vibing on the vibers.
The original5 article is from the Daily Sceptic (tagline: question everything, stay sane, live free6) and it looks at changes in the HadCRUT global averages over the years. Because they haven’t read the papers, which described these changes and the reasons for them (in frankly tedious detail), they don’t understand what they’re looking at, so all that’s left for them to do is make the linguistic equivalent of the dismayed noises our neighbour’s dog makes whenever there’s thunder – he doesn’t understand it, but he sure doesn’t like it.
The criticism, such as it is, is that the best-estimate global averages changed. That’s it. It focuses on two periods in particular: the hiatus (which they claim has disappeared; it hasn’t), and the warmish period around the second world war (which they also claim has disappeared; it hasn’t).
Before we start, here’s what the global temperature series look like from HadCRUTs 3 through 5 with some notable variants – the non-infilled HadCRUT5 and the Cowtan and Way infilled version of HadCRUT4. The differences we’re talking about are pretty small in the grand scheme of things.
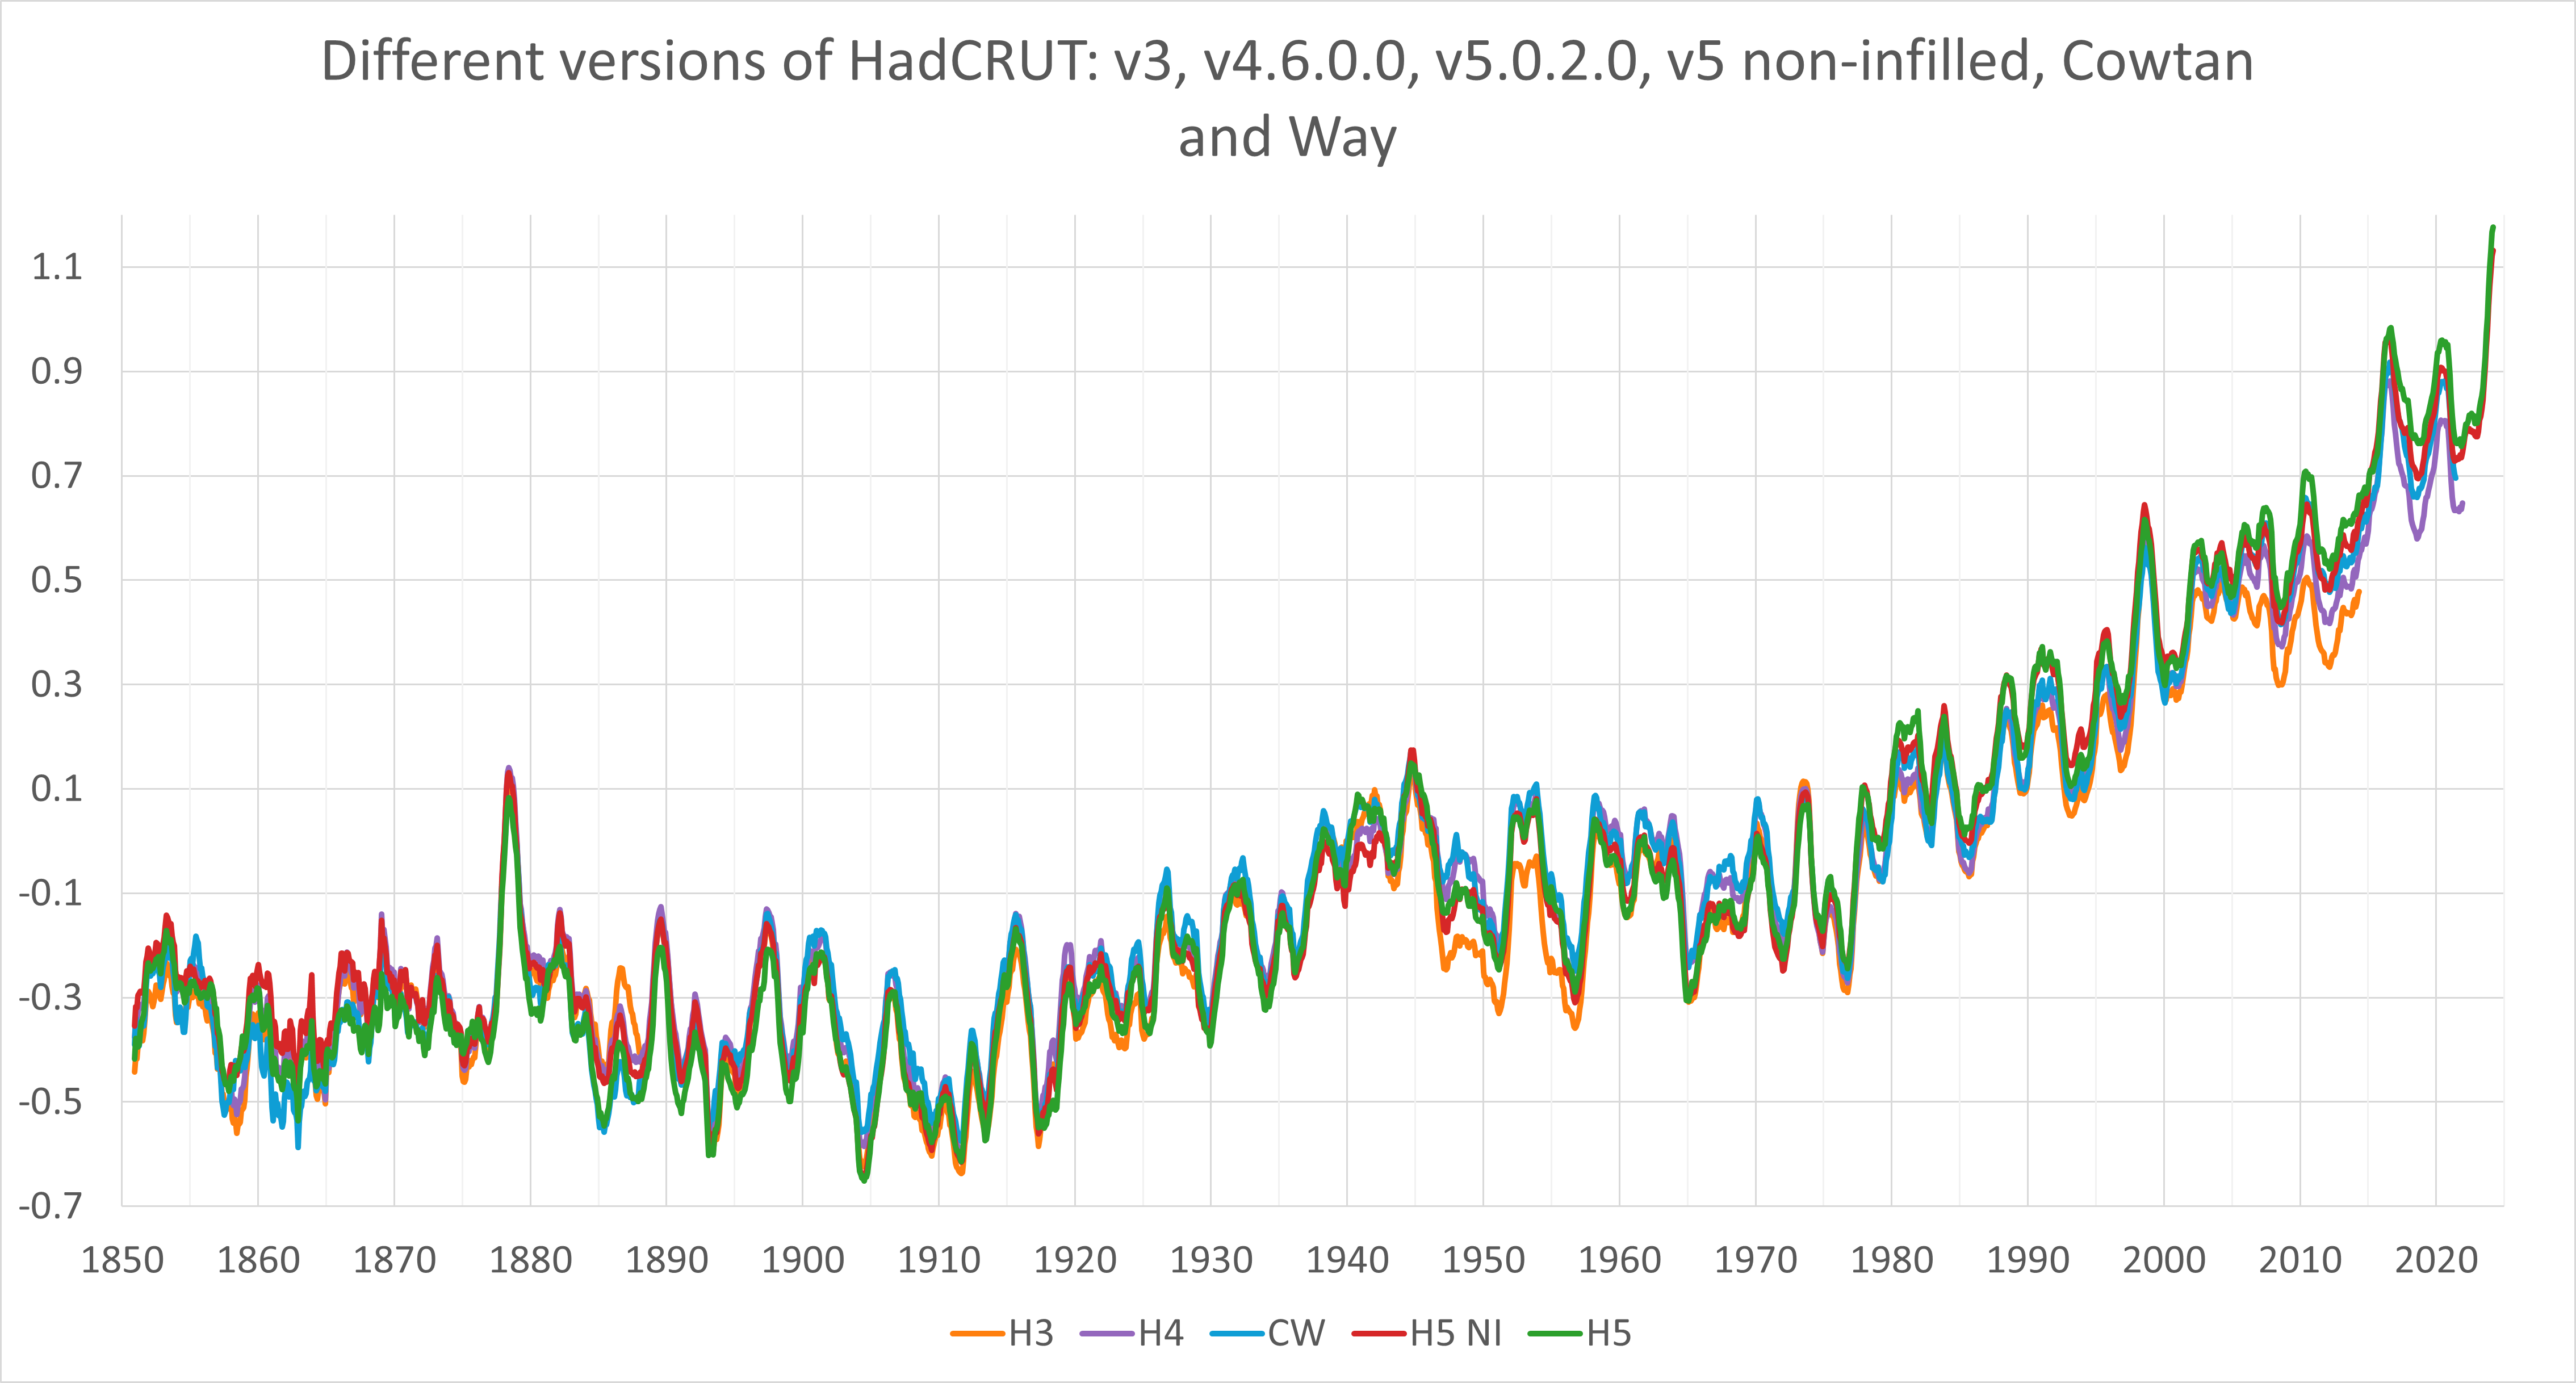
And here’s what the differences between them look like:

THE HIATUS
First, the hiatus7. It’s still there, depending a little on how you define the thing. It’s comparable in its way to the temperature responses to the eruptions of El Chichón in the 80s and Mt Pinatubo in the 90s. Still, the rate of change is higher in the latest version of HadCRUT8 (HadCRUT.5.0.2.0 at time of writing) than it was in HadCRUT3 (the data set which was current in 2008). This is for a couple of reasons.
- HadCRUT3 had big data gaps particularly at higher latitudes. Higher latitudes of the northern hemisphere warmed much faster than the rest of the world, with a big surge in 2005. The HadCRUT3 average was based on those grid cells that contain data and thus was skewed towards more slowly warming parts of the world. Cowtan and Way made this abundantly clear in their 2014 paper, but it was a known issue even before then.
- From the early 90s to present, the way that sea surface temperatures9 have been measured has changed, going from mostly ship-based measurements to mostly buoy-based measurements. Ships tend to measure warmer than buoys, on average, so the you need to align the two data sources before combining them otherwise you get an artificial cooling as we shift from mostly ship in the 1980s to mostly buoys today.
- While ship measurements are on average too warm, they haven’t always been too warm by the same amount. The systematic error was largest in the 60s and has declined since then, with some ups (most recently in the early 2000s) and downs (most recently since the early 2000s). Again, this has nothing to do with the climate and everything to do with the measuring technology. Failing to account for these changes would lead to artificial variations in temperature – both up and down depending on the time period.
HadCRUT3 had all three of these of problems and they were fixed in HadCRUT4 (which addressed point number 2 and, to a lesser extent point 1) and HadCRUT5 (which addressed points number 1 and 3).
Point 1 was addressed in two ways. First, by getting more data and updating stations that don’t regularly report on the GTS10, which filled in some of the gaps at high latitudes (and elsewhere), and second, by infilling the remaining gaps statistically.
The SST changes were a bit more involved, but boil down to looking at the aggregated differences between different methods and effectively removing the offsets before combining the data11. The results were checked by comparing to subsets of SST data made using a single method (or closely related group of methods, including (a) buoys, (b) Argo floats, and (c) satellite data which cover some or all of the hiatus period. The last of these two – Argo and satellites – are independent of the SST data used in HadCRUT.
If you don’t think the changes during the hiatus period were necessary, you’re saying that the changes in coverage of station data and the changes in SST measurement methods have no effect on global temperature estimates or a different effects. That’s quite a case to make and there’s a huge amount of evidence against it. As it happens, they don’t even try: they just don’t like the results.
THE SECOND WORLD WAR
Between 1939 and 1945, global shipping (along with many other things) was changed utterly. The data we have from this period is distinctly different in source and composition from years (and even months) either side. Partly that’s due to actual changes in shipping, but also partly due to how those data have come down to us – the process isn’t always smooth.
As well as changes in shipping, it’s long been known that prior to the war, ships were widely using canvas buckets to make SST measurements. However, it was assumed that, come the war years, they started to use water temperature measurements made in the engine room using water sucked in to cool the engines and so forth. This was safer, particularly at night when you no longer had to take a torch onto the deck with you while you unspooled the bucket and made the readings, all the while wondering if its bobbing light would catch the attention of a passing enemy submarine.
There was also a lot going on that was climatically interesting. There was a peak in global temperatures, which was the culmination of what’s come to be known as the early twentieth century warming and it preceded a longish period of little warming, or cooling often associated with man-made aerosols. There was a major and protracted El Nino. The Pacific Decadal Oscillation maybe flipped sign, and so on. From the point of view of understanding all these things, it’s unfortunate that the source data are also changing around then. It makes picking out the different factors rather more difficult.
In HadCRUT3, SST data were adjusted to account for the use of buckets up to the start of the war, with a rapid ramp down in usage between 1939 and 1941, but left unadjusted thereafter. The assumption was that once everyone started making engine room measurements (with maybe a few ships still using buckets) during the war, the habit stuck with a “modern mix” of measurement methods that then stayed largely unchanged. It was easier and safer to make engine room measurements – even without enemy shipping to worry about – and in many cases they were taking those measurements anyway.
However, it was clear that there were still some nations making wide use of buckets even after the war, so HadCRUT4 was a first attempt to deal with that using metadata which said how measurements were made. Splitting the data into ships which used buckets and ships which used engine room measurements showed that the latter were clearly warmer. At the end of the war, there was a rapid shift back to merchant shipping that were more likely to use buckets and hence something of an artificial cooling. The metadata suggested that some of that cooling – but by no means all – was due to that transition from engine room to buckets. On the other hand some of it was probably real. The actual war years themselves were estimated to be slightly too warm, but also very uncertain (i.e. they might be too warm or too cool) as metadata were poor or non-existent during that period. Large uncertainties also affected the post-war years up till the early 1980s when metadata became more complete and reliable.
There was some interesting research after HadCRUT4 came out that looked in more detail at the metadata and how measurements might have been made. HadCRUT5 used this information together with longer series of oceanographic measurements to identify biases in the data. There was still a lack of information regarding world war two, so a larger uncertainty range was assigned to that period than in others. The post-war cooling was larger in HadCRUT5 too reflecting a larger percentage of engine room measurements than was assumed in HadCRUT4.
Infilling also had something of an effect on the Second World War period. The Arctic was warm in the 1930s and 1940s too (with lower sea ice extents in the Atlantic sector) and poor coverage at higher latitudes meant that statistical infilling led to higher anomalies between about 1930 and 1950 though not so consistently as in the 2000s.
The reason I mention all this is because the Daily Sceptics seem to think that the second world war has been systematically cooled since HadCRUT3 came out. As far as I can tell, that’s not actually true. HadCRUT3 and HadCRUT5 are quite similar during the war years and HadCRUT5 is somewhat warmer than HadCRUT3 in the years immediately following the war. It looks like they may have used the non-infilled version of HadCRUT5, but it’s hard to tell. The original source suggests they are still using HadCRUT4, so who knows. Perhaps their critique isn’t even just wrong, but also out of date.
DISCUSSION
Now, it’s important to point out that HadCRUT5 is not the final word, just as the HadCRUTs one through four weren’t. Interesting and important uncertainties remain and libraries and archives around the world hold huge amounts of undigitised data which could help to get a better understanding of global temperature change if we could only get them out of the archives and onto computers. There are, therefore, useful criticisms to be made of the methods and assumptions that go into HadCRUT (and other global temperature data sets) as well as scope to fill many of the gaps.
Indeed, useful and insightful criticisms are being made, just not by the grumblers. Teams at Harvard and Southampton have been looking critically at the methods used to adjust sea surface temperatures in HadCRUT and found a number of outstanding issues12. The old weather team has been rescuing data, which will help to fill some of the gaps in coverage.
We haven’t seen any kind of interesting analysis from the climate grumblers and we won’t as long as they keep objecting to the results without every understanding where they come from (or describing the water). It’s not hard to find out where they come from because its all written up in the papers describing the datasets13. Go read them. Critically. And question everything: it’s clear the daily sceptics aren’t.
-fin-
- OK: Lots of reasons promotion, yearning to be a writer, boredom, bonnet full of bees, procrastination on another more pressing task, fulfil the terms of a grant agreement… However, the socially acceptable reason is the one mentioned in the headtext to this footnote. ↩︎
- It used to be said that the majority of papers were only ever read by the author and maybe a reviewer or two. With the advent of large language models, that modest number can easily be reduced to zero at industrial scale. However, one suspects that there were already papers that qualified in so far as writing doesn’t count as reading or, in its worst extremity, thinking. ↩︎
- The average critic is far below average. ↩︎
- Unread, of course. ↩︎
- A rather kind word for this sort of reheated pabulum. ↩︎
- One wonders if someone who questions everything is, in a meaningful sense, free. Or sane for that matter. ↩︎
- Or whatever you want to call it. I was calling it the “recent slowdown in the short-term rate of global temperature change” but it’s not really recent any more. ↩︎
- I’m referring to both land and ocean components as HadCRUT for simplicity here, but the land and ocean datasets are developed separately by largely different people. The land dataset is CRUTEM (developed largely by CRU) and the ocean dataset is HadSST (developed largely by the Met Office). The numbering can be quite confusing – HadCRUT5 is CRUTEM5 plus HadSST4 so I’ve stuck with HadCRUT throughout. ↩︎
- Sea surface temperatures – the literal water temperature of the surface of the sea – are used rather than air temperatures by most global temperature datasets because SST measurements are more numerous thanks to all those buoys (and also, latterly, satellites). Some argue that the measurements of SST are less variable so you need less of them to get the same standard error, but my personal opinion is that this is offset somewhat by the lower quality of ship SST measurements generally. ↩︎
- Global Telecommunication System, used to transmit meteorological and climatological data around the world. ↩︎
- It was actually done the other way round: aggregating the offsets and applying them to the aggregated data, but the effect ought to be the same. If you don’t believe me, try it. ↩︎
- I feel like a note is warranted here to stop the sceptics getting too excited. The team found that in reality, world war two was likely cooler than its current representation in HadCRUT. They also found that decadal differences in the warming rates of the Atlantic and Pacific were partly artificial and ocean warming is actually more uniform than depicted in HadCRUT. Both results suggest less natural variability. ↩︎
- And references therein. etc. ↩︎

Leave a comment